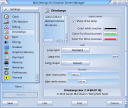
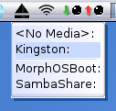
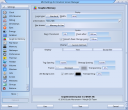
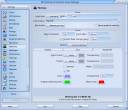
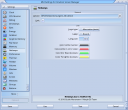
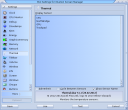
Screenbar modules are plugins which can populate the empty area on the screen tittle bar with some useful information and usage. The modules are visible on every (MUI) screen, which makes them more useful than for example Panel Objects which are only seen on the Ambient screen and can be left under some other windows.
Screenbar modules can be enabled and disabled from the screen depth gadget menu. The menu also contains options to arrange the order of the modules and to change their settings. The menu can be accessed by pressing the right mouse button, or with a long left press, over the screen depth gadget.
Here is a list of the built-in modules and their charasteristics.
Standard Modules

Clock
- A customizable string to show the date related values in every possible way.
- Double click opens the MorphOS Time preferences.
|
|

|

CPU Monitor
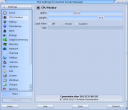
- A CPU load graph with task filtering options.
- Double click opens a big CPU load window.
|
|

|

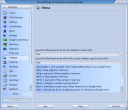
Debug
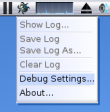
- Opens a debug menu with the left mouse click.
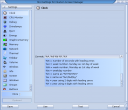
- "Show Log..." is a useful option to check if everything has behaved OK in your system.
|

|

|

Drivelamps
- Shows activity lamps for any massstorage devices connected via IDE, SATA, USB, or SCSI.
- Separates reads and writes by different colors.
|
|

|

Eject
- Ejects and/or unmounts devices when clicked with the left mouse button.
- Ejects the CD drive if there isn't anything else to unmount, but otherwise gives an eject menu.
- Can unmount mounted ISO images, SMBFS mounts, Kryptos and other fileimages, USB drives, etc.
|

|

|

Energy
- Shows the battery charge on laptops.
- Double click opens an Energy Information window with detailed information about the battery and the current drain.
|
|

|

Graphicsmemory
- Shows the graphics memory usage.
- Can show the information as percentage or megabytes, and/or as a graphical gauge bar.
- Double click opens the GraphicBoards utility.
|
|

|

Memory
- Shows the usage of system RAM and/or graphics memory.
- Can show the information as percentages or megabytes, and/or as graphical gauge bars.
- Double click opens the Fragment utility.
|
|

|

Network
- Shows activity lamps for a network device.
- Double click opens the Network Statistics window with comprehensive information and graphs about the network traffic.
|
|

|

Thermal
- Monitors the temperature sensors.
- Can show or cycle between CPU, NorthBridge, GPU, and Trackpad sensors.
|
|

|

Titlebar
- The screen title works as a screenbar module too, although it's always enabled.
- Can be configured to show much more than just the original information. For example memory and battery information, contents of ENV variables, etc.
|
|

|

Volume
- Controls the audio output volume.
- Using the mouse wheel over the module adjusts the volume and a left mouse click opens the volume slider.
- The "Save mixer settings" setting defines if the volume change is saved permanently every time you change it.
|

|

|

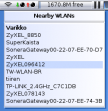
Wireless
- Shows the wireless network status.
- A left mouse click scans for nearby WLANs and shows results in a popup menu.
|

|
|
Run Time Modules
These screenbar modules are only shown in run time when certain program is launched.
3rd Party Modules
3rd party modules should always be installed in the SYS:Classes/Screenbar directory. The Modules->Rescan option from the screen depth menu activates the newly installed modules without a reboot.
There's a great amount of 3rd party modules from small funny gadgets to more serious and informative ones.
